Graph Recipesmade by the médialab
a web environment to work with JavaScript on a GEXF network: compute metrics, produce images, and tinker with Graphology
Tools – Software
Mathieu Jacomy
Based on the "graphology" JavaScript library, Graph Recipes is a web app bridging visual exploration and scripting. It enables users to import graph data stored as a GEXF file in order to produce statistics and/or visualizations.
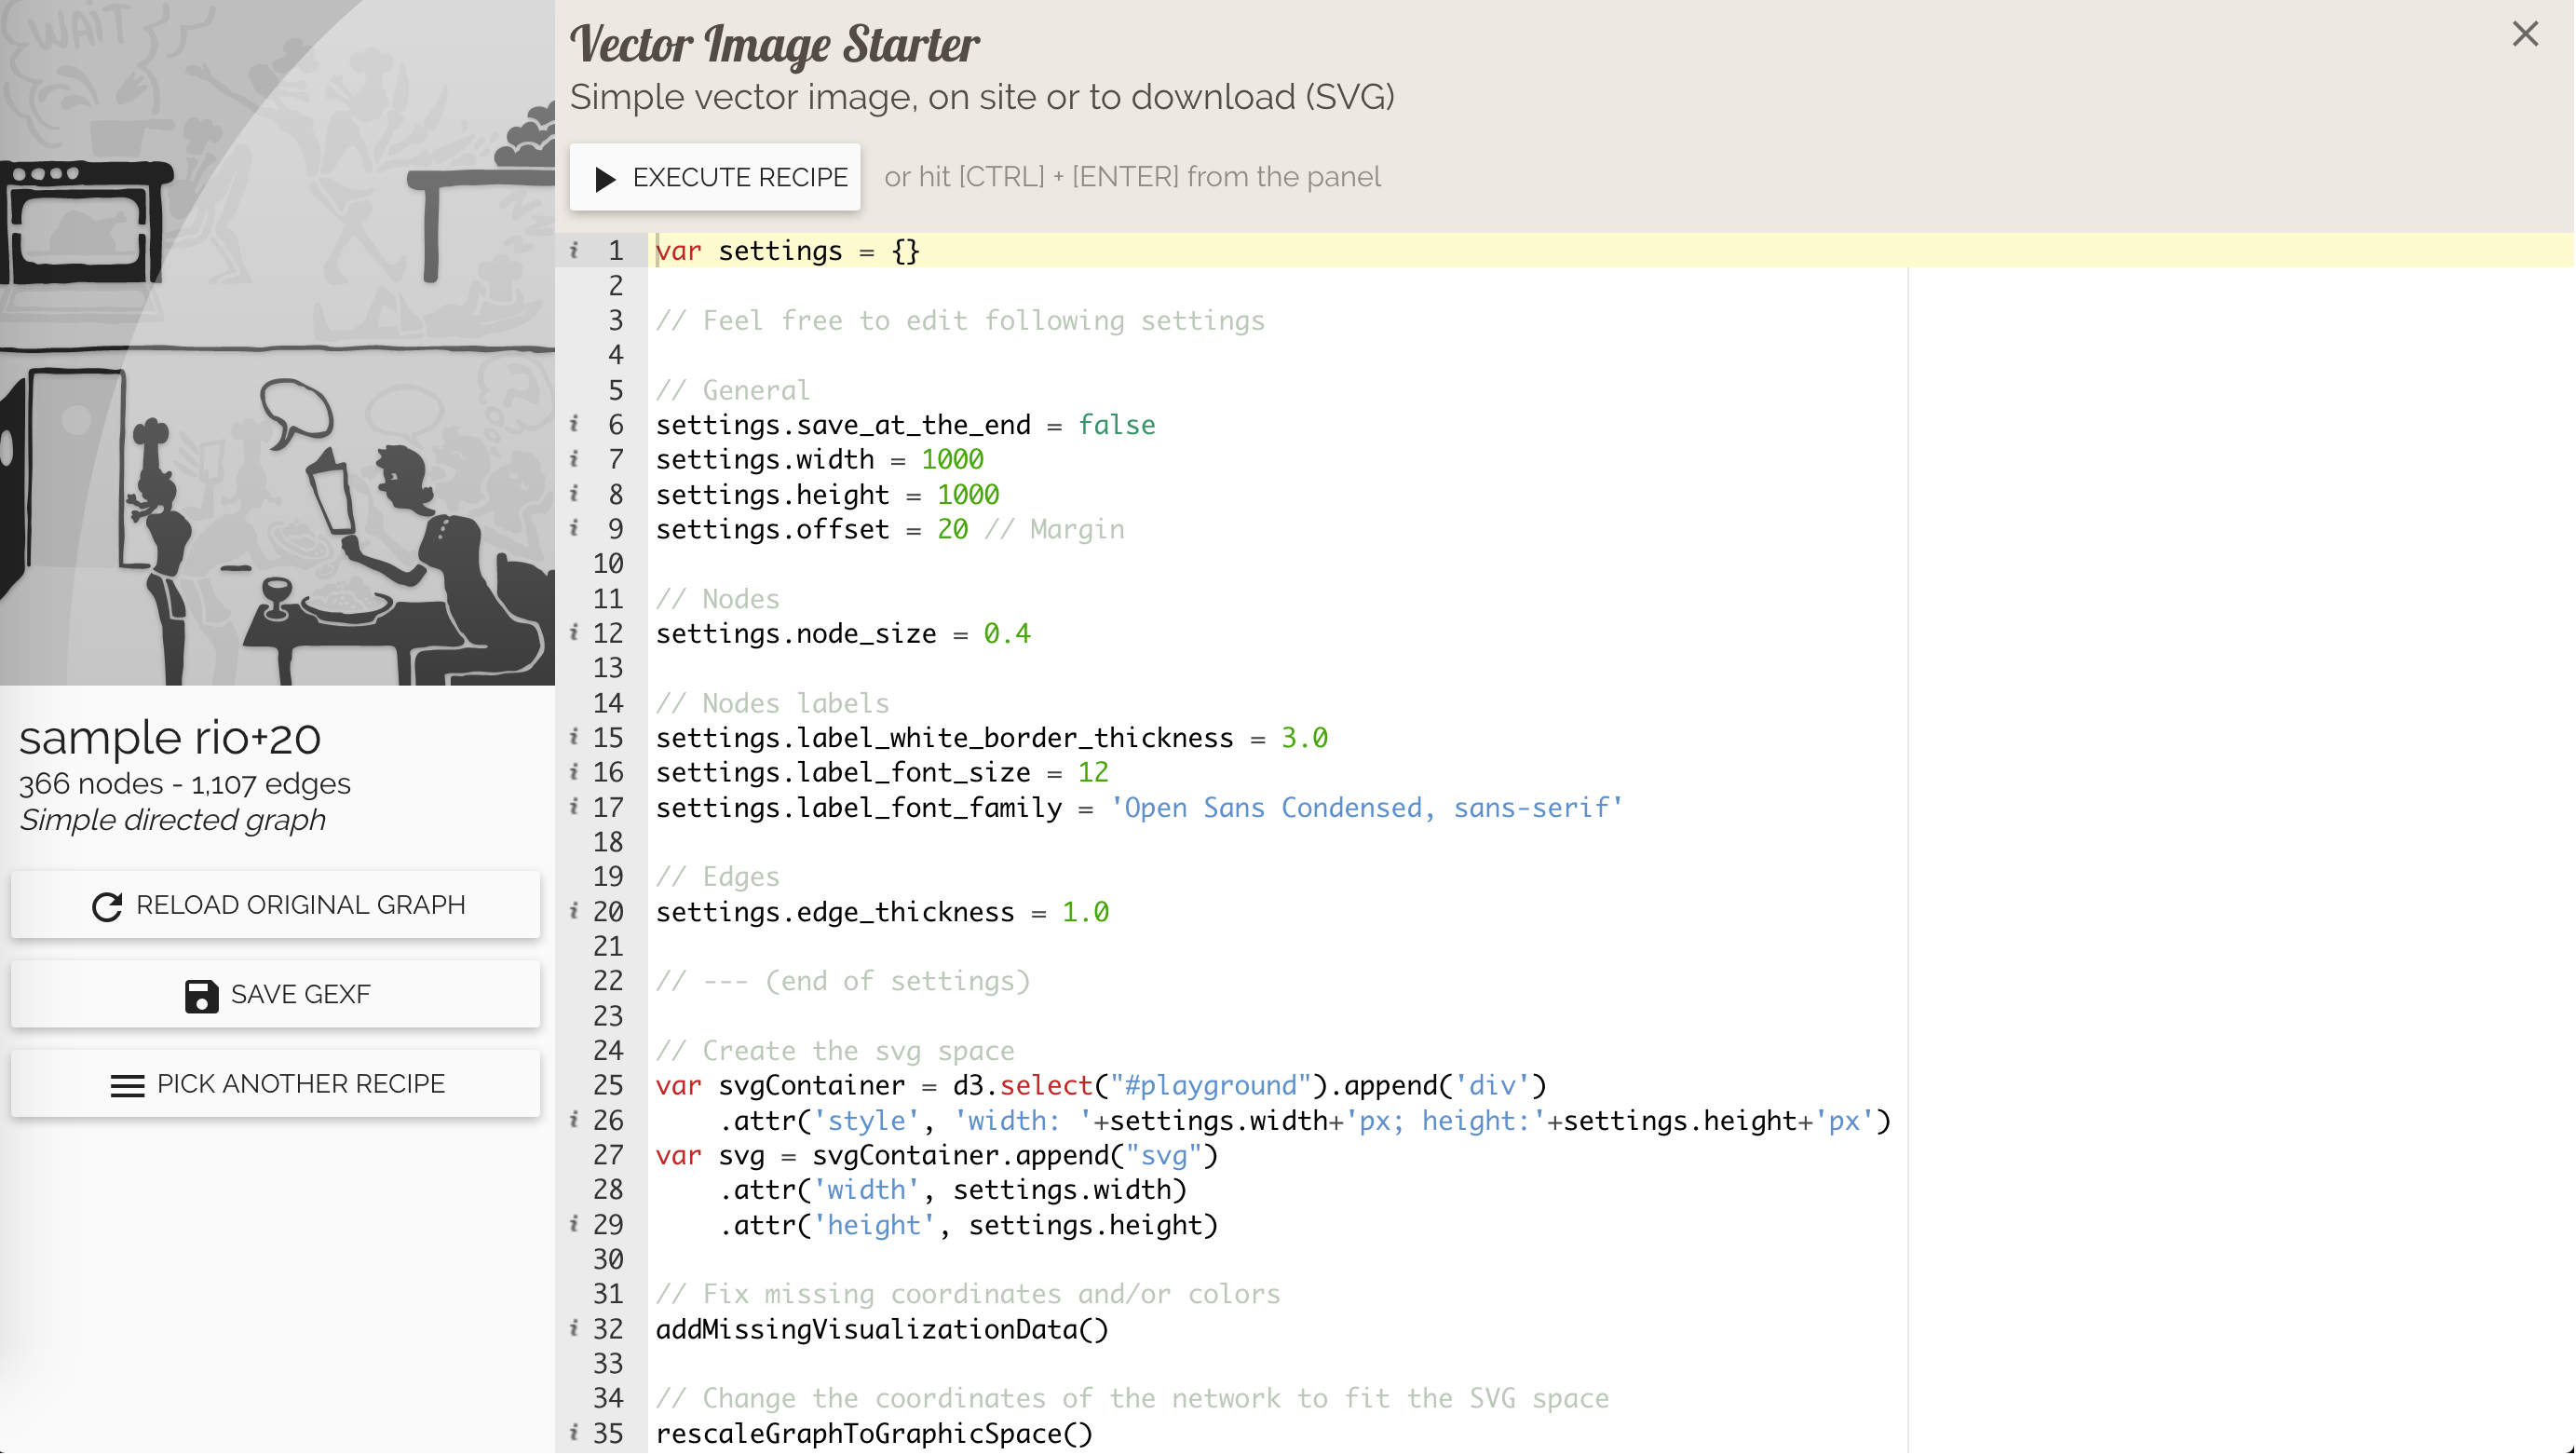
The app also enables JavaScript-savvy users to develop their own scripts to produce custom results.
Some examples of the app's capabilities:
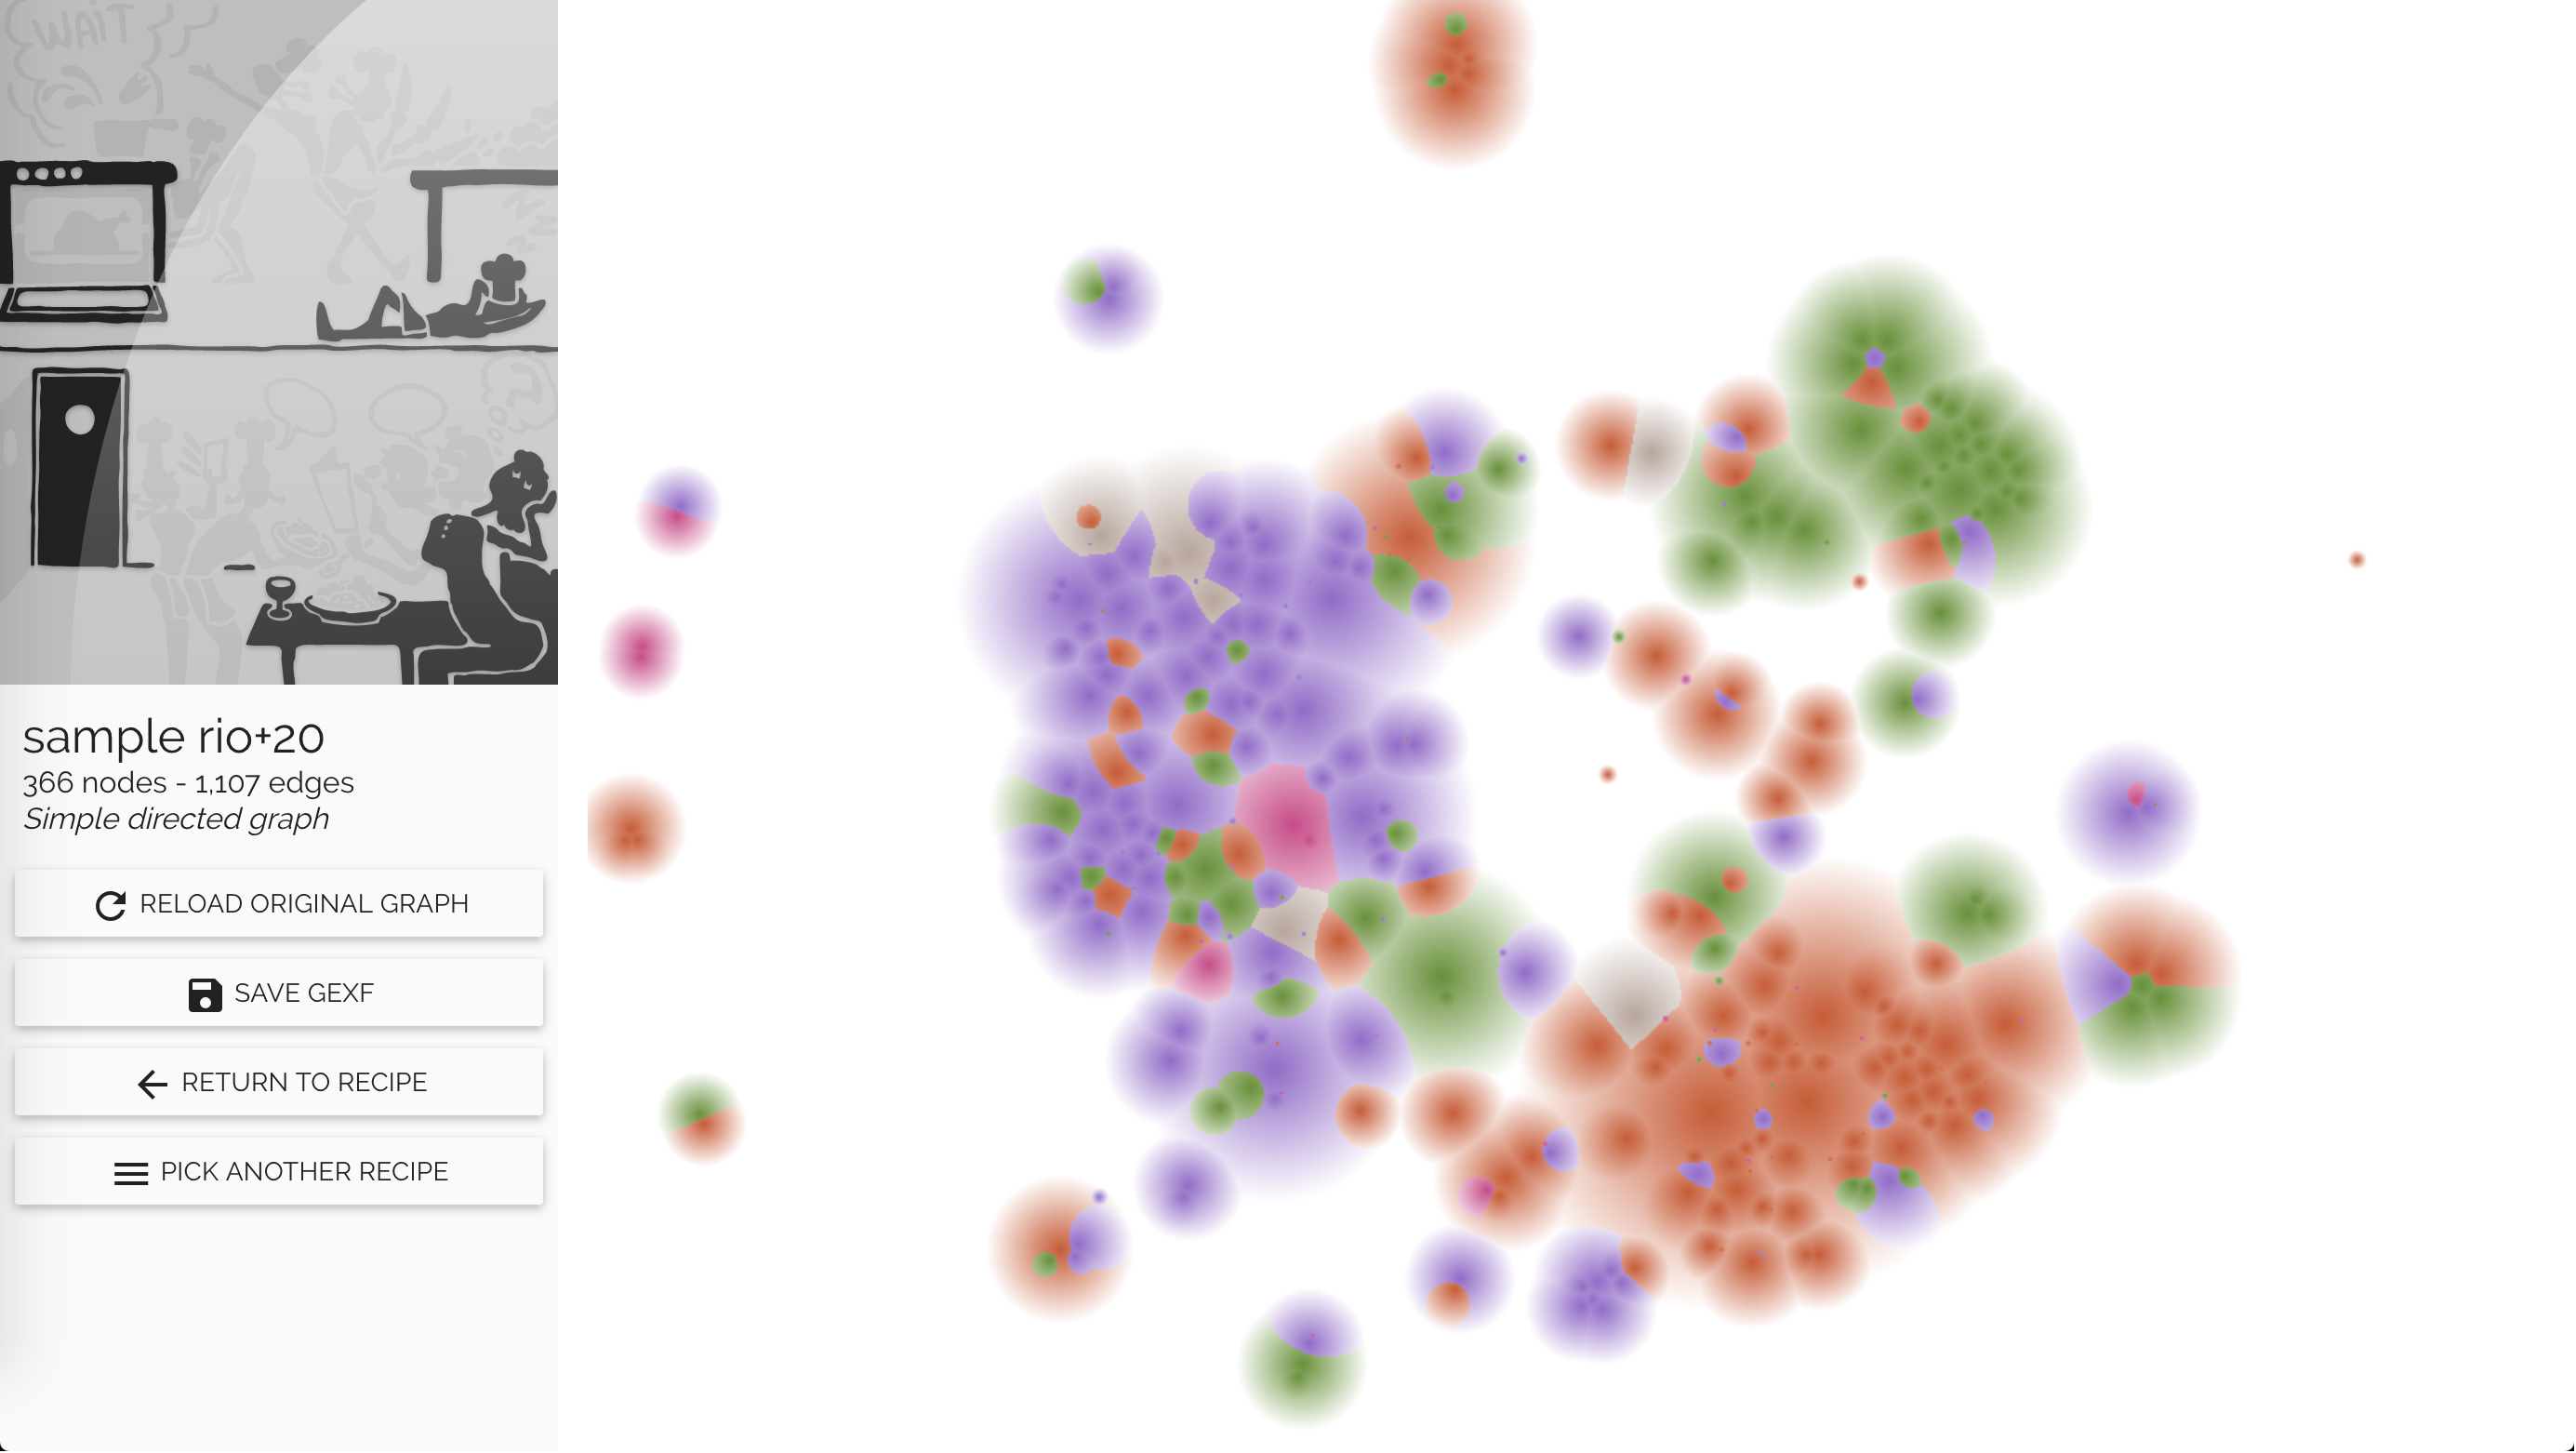
- Raster image of the graph
- Vector image of the graph
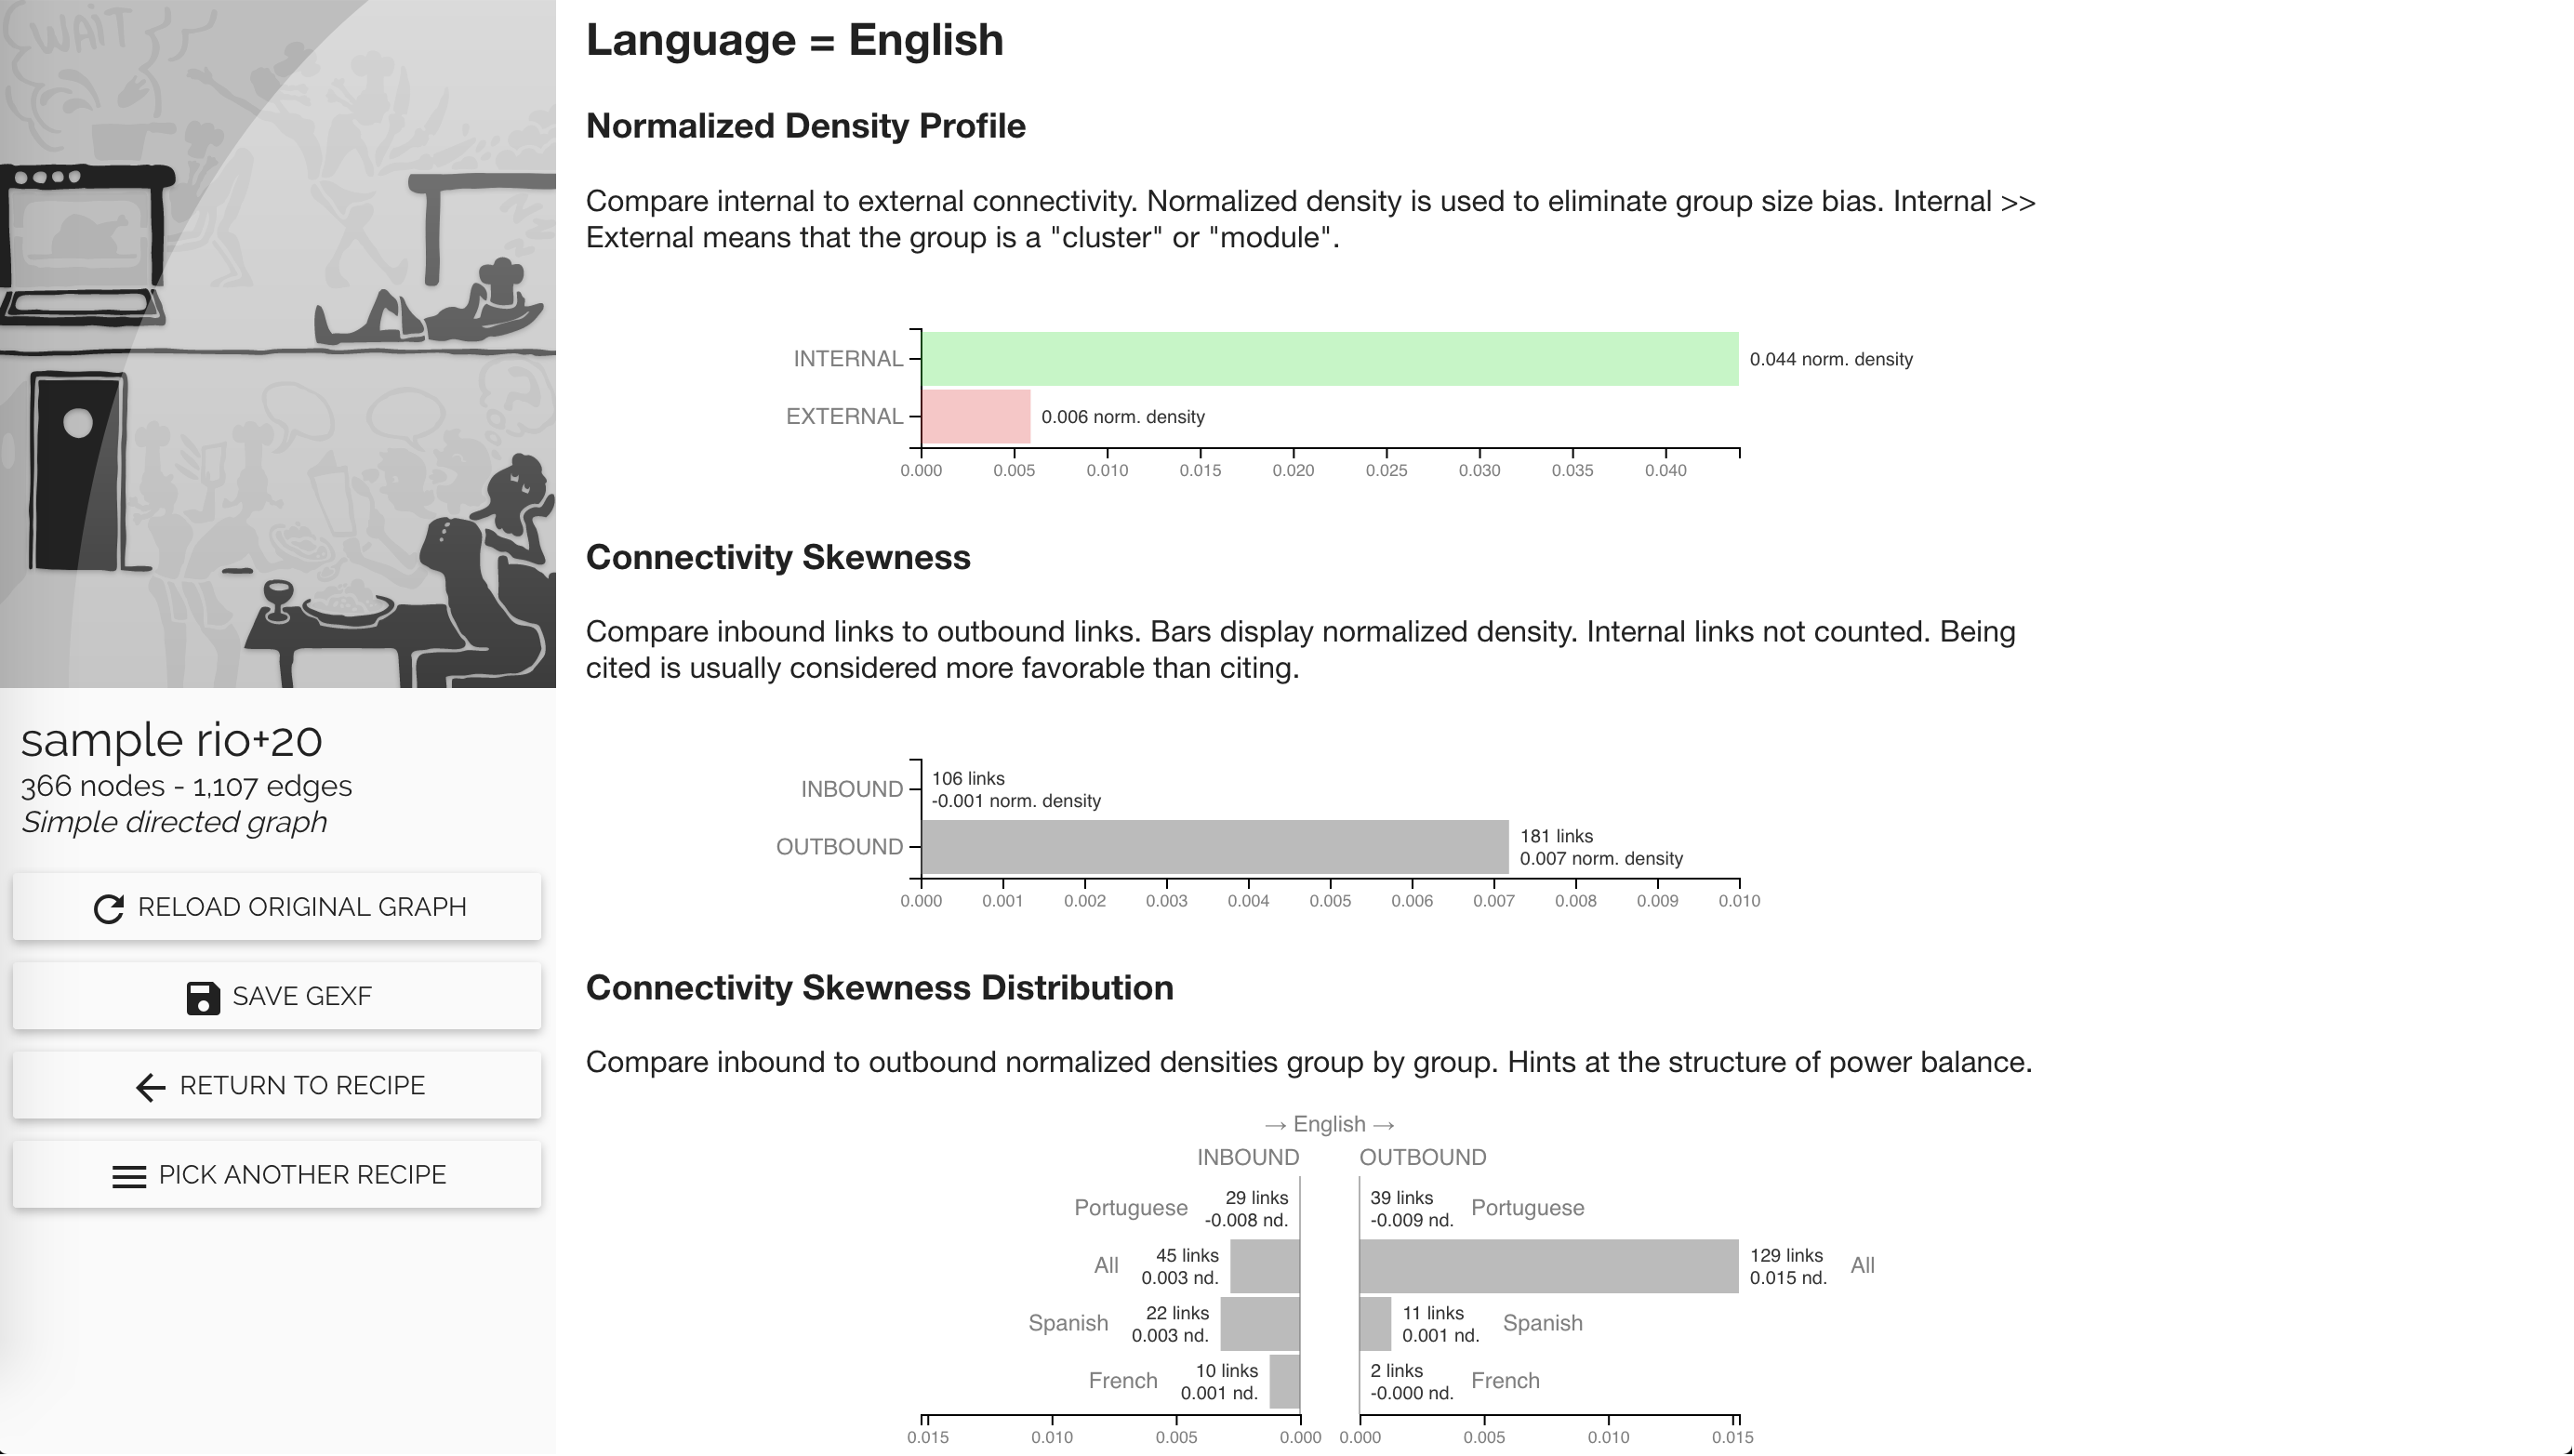
- Partition statistics computation
- Heatmap rendering
- etc.
processing, exploration and visualization
developers
usable
2016