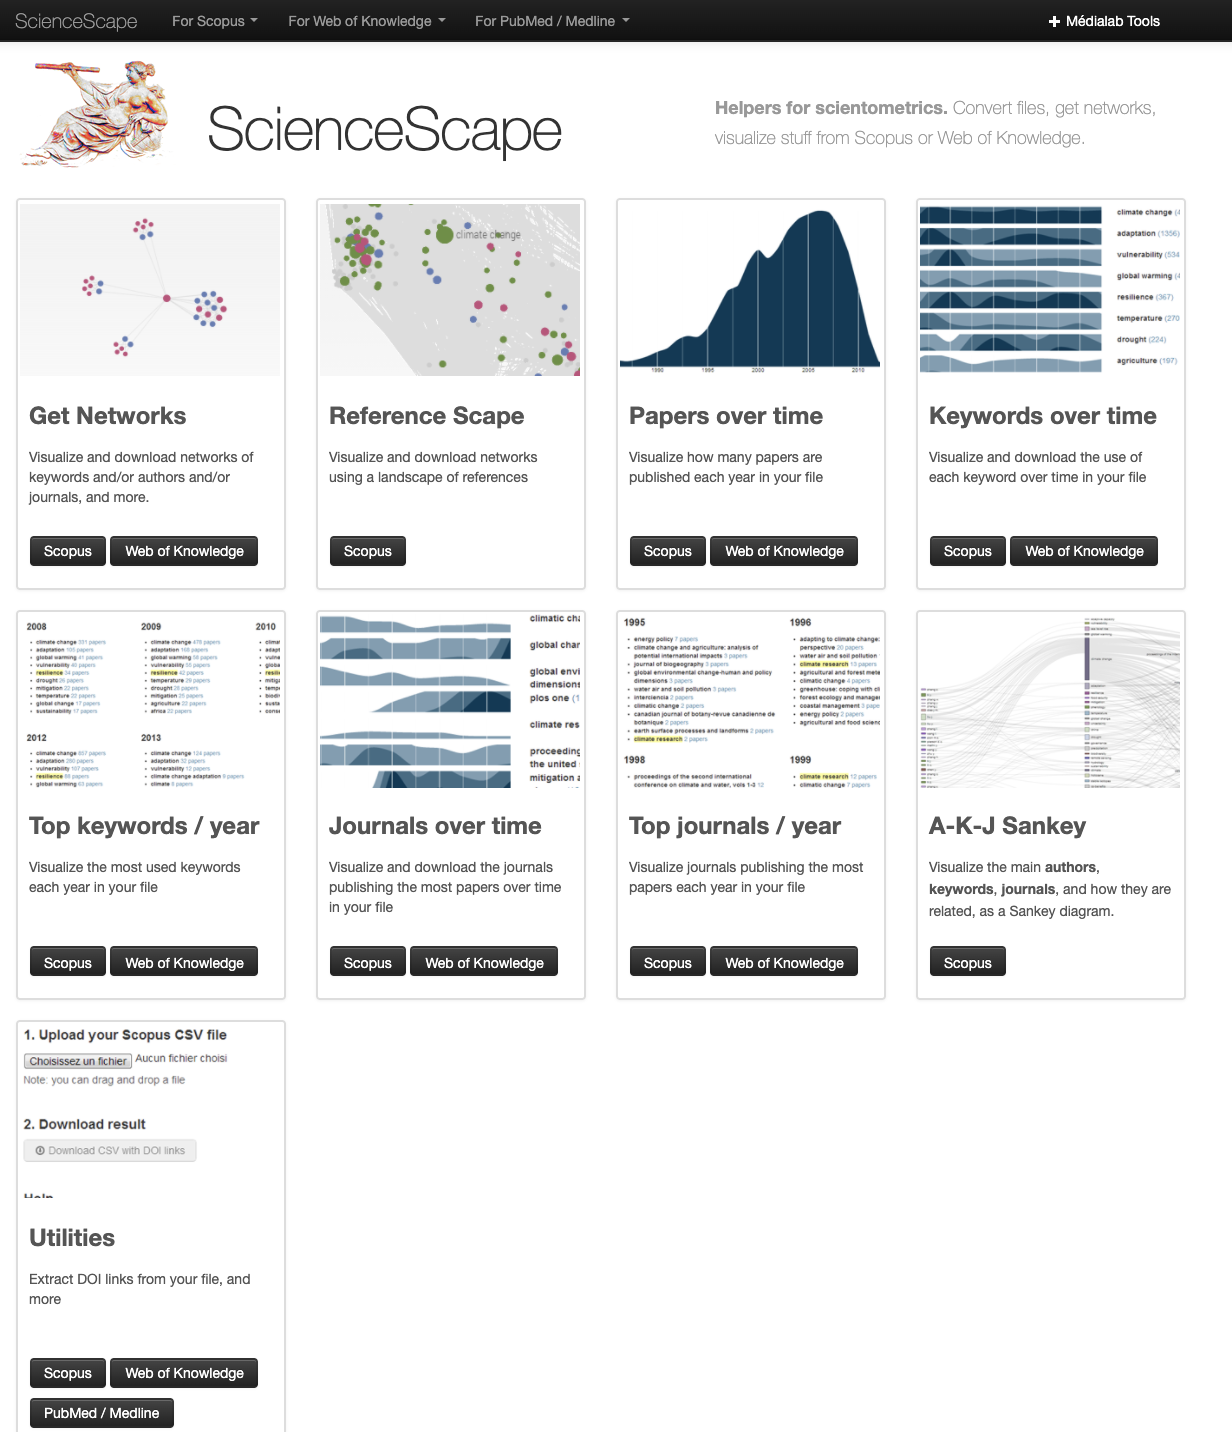
ScienceScapemade by the médialab
features various tools for scientometrics, such as file conversion, networks building or visualization tools for Scopus or Web of Science
Tools – Software
Mathieu Jacomy
An online board of scientometric tools to convert csv files from Web of knowledge or Scopus databases into simple data visualisations:
- Get networks: visualize, explore and download networks of keywords and/or authors and/or journals, and more.
- Reference scape: visualize, explore and download networks of bibliographical references
- Papers over time: visualize how many papers are published each year
- Keywords over time: visualize and download the use of each authors’ keyword over time
- Top keywords per year: visualize the most used keywords each year
- Journals over time: visualize and download the journals publishing the most papers over time
- Top journals per year: visualize journals publishing the most papers each year
- A-K-J Sankey diagram: visualize the main authors (A), keywords (K), journals (J) and how they are related as a Sankey diagram
- Utilities: extract data from your csv file from Scopus or Web of knowledge such as DOI links
The online board is available here: http://medialab.github.io/sciencescape/
exploration
all audiences
usable
2013