Rawgraphsrecommended by the médialab
a simple and efficient tool for scaffolding complex visualizations online
Tools – Software
Michele Mauri, Tommaso Elli, Giorgio Caviglia, Giorgio Uboldi, Matteo Azzi
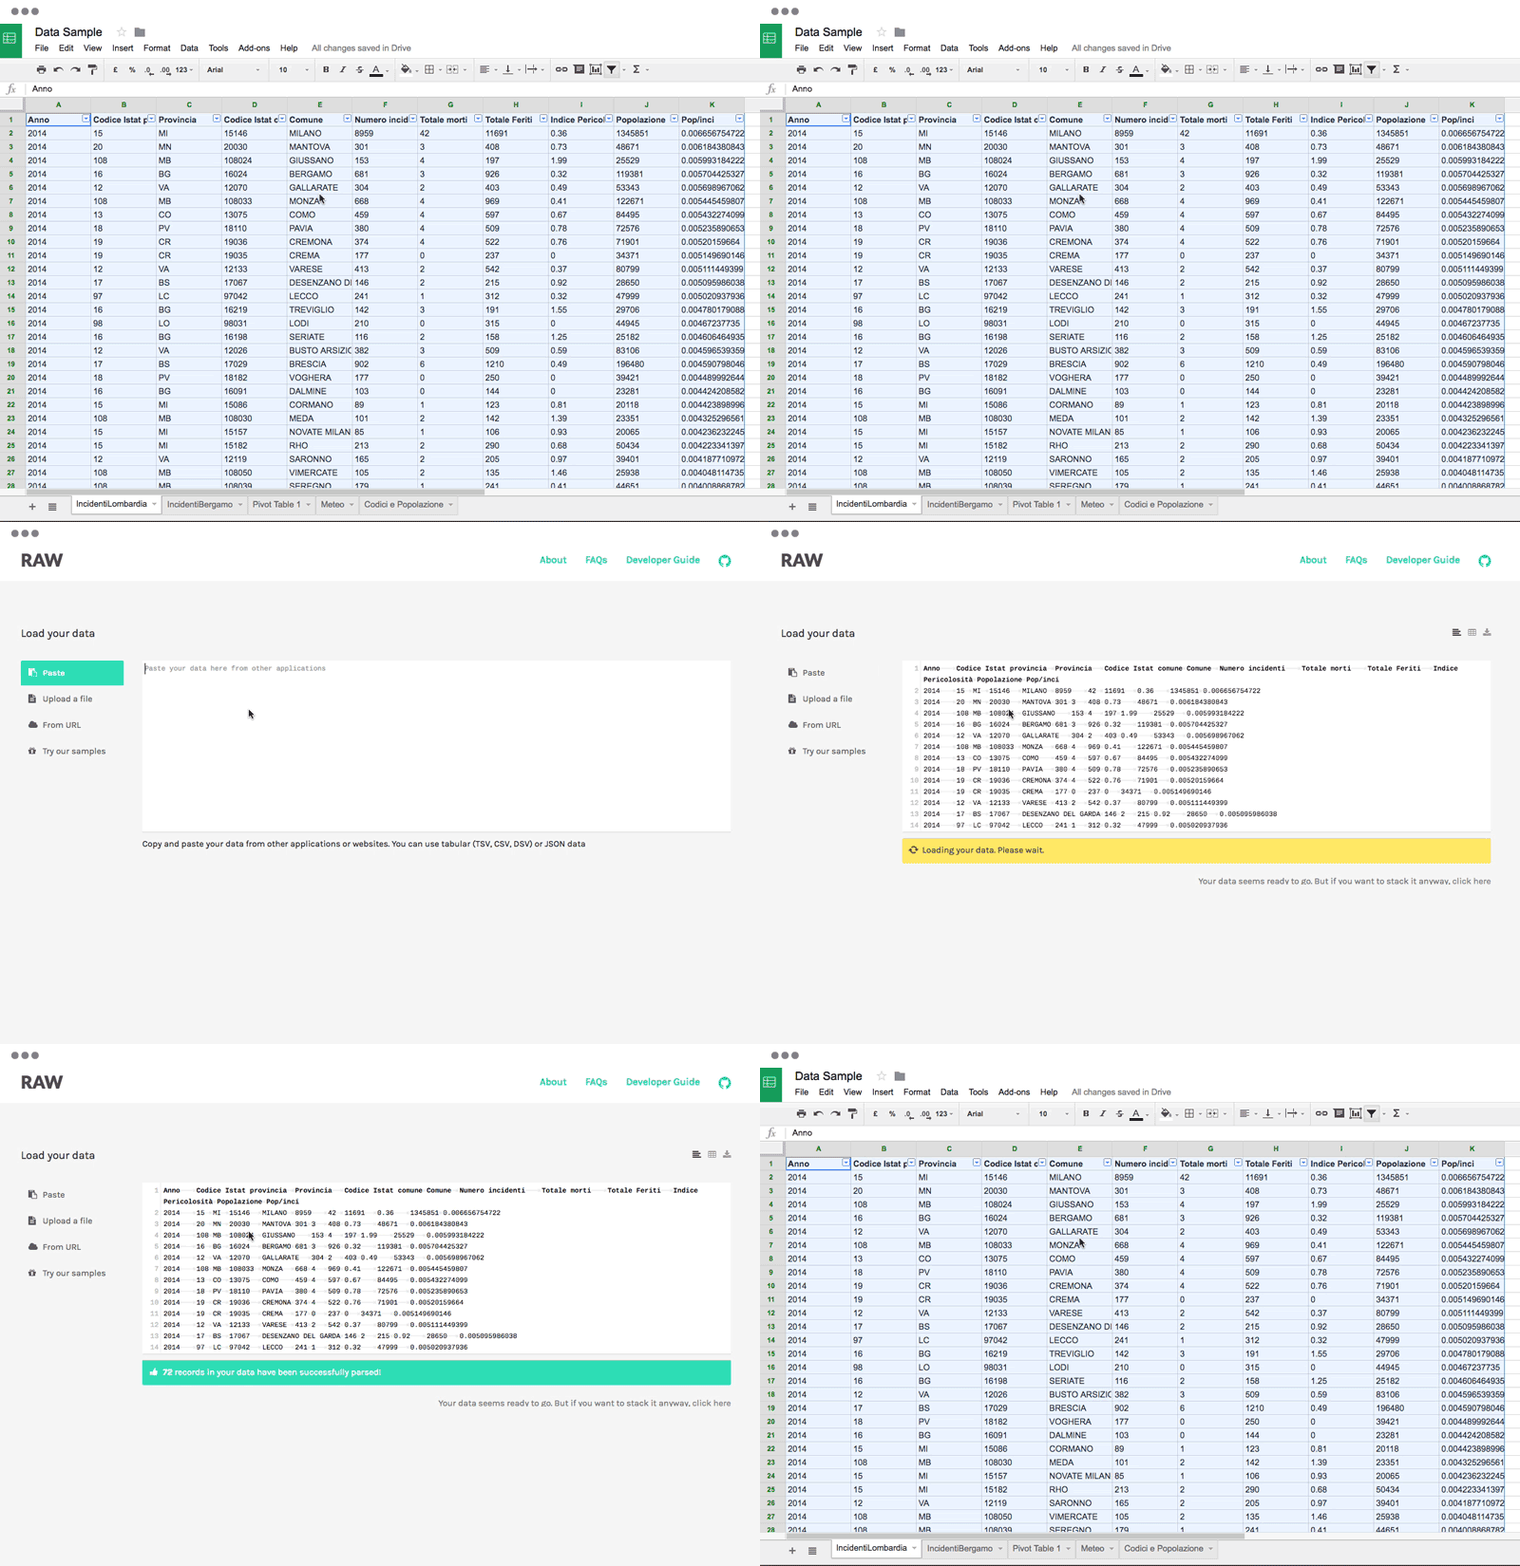
Rawgraphs is an online tool allowing to build visualizations from tabular data (.csv, excel, framacalc, google spreadsheets,...).
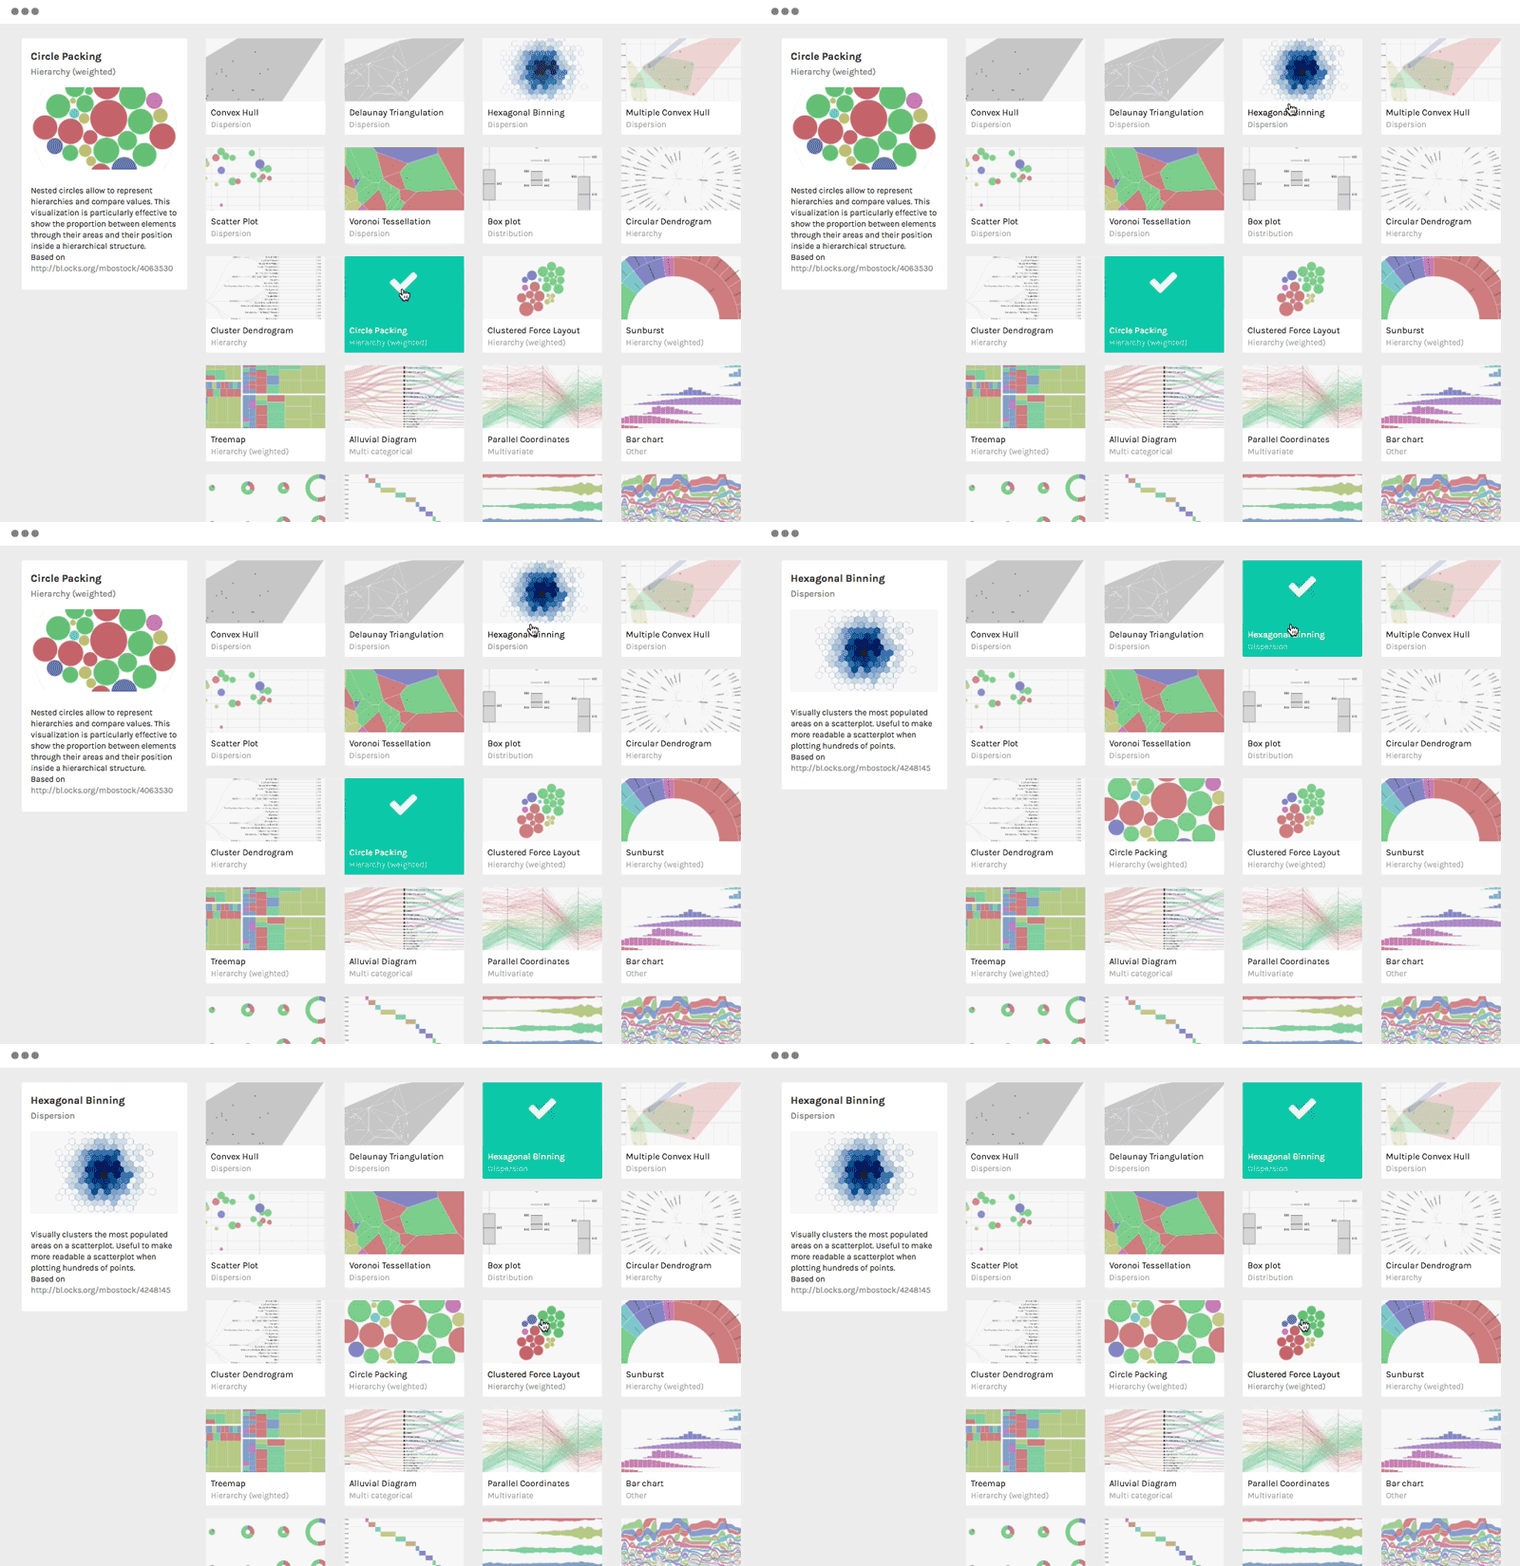
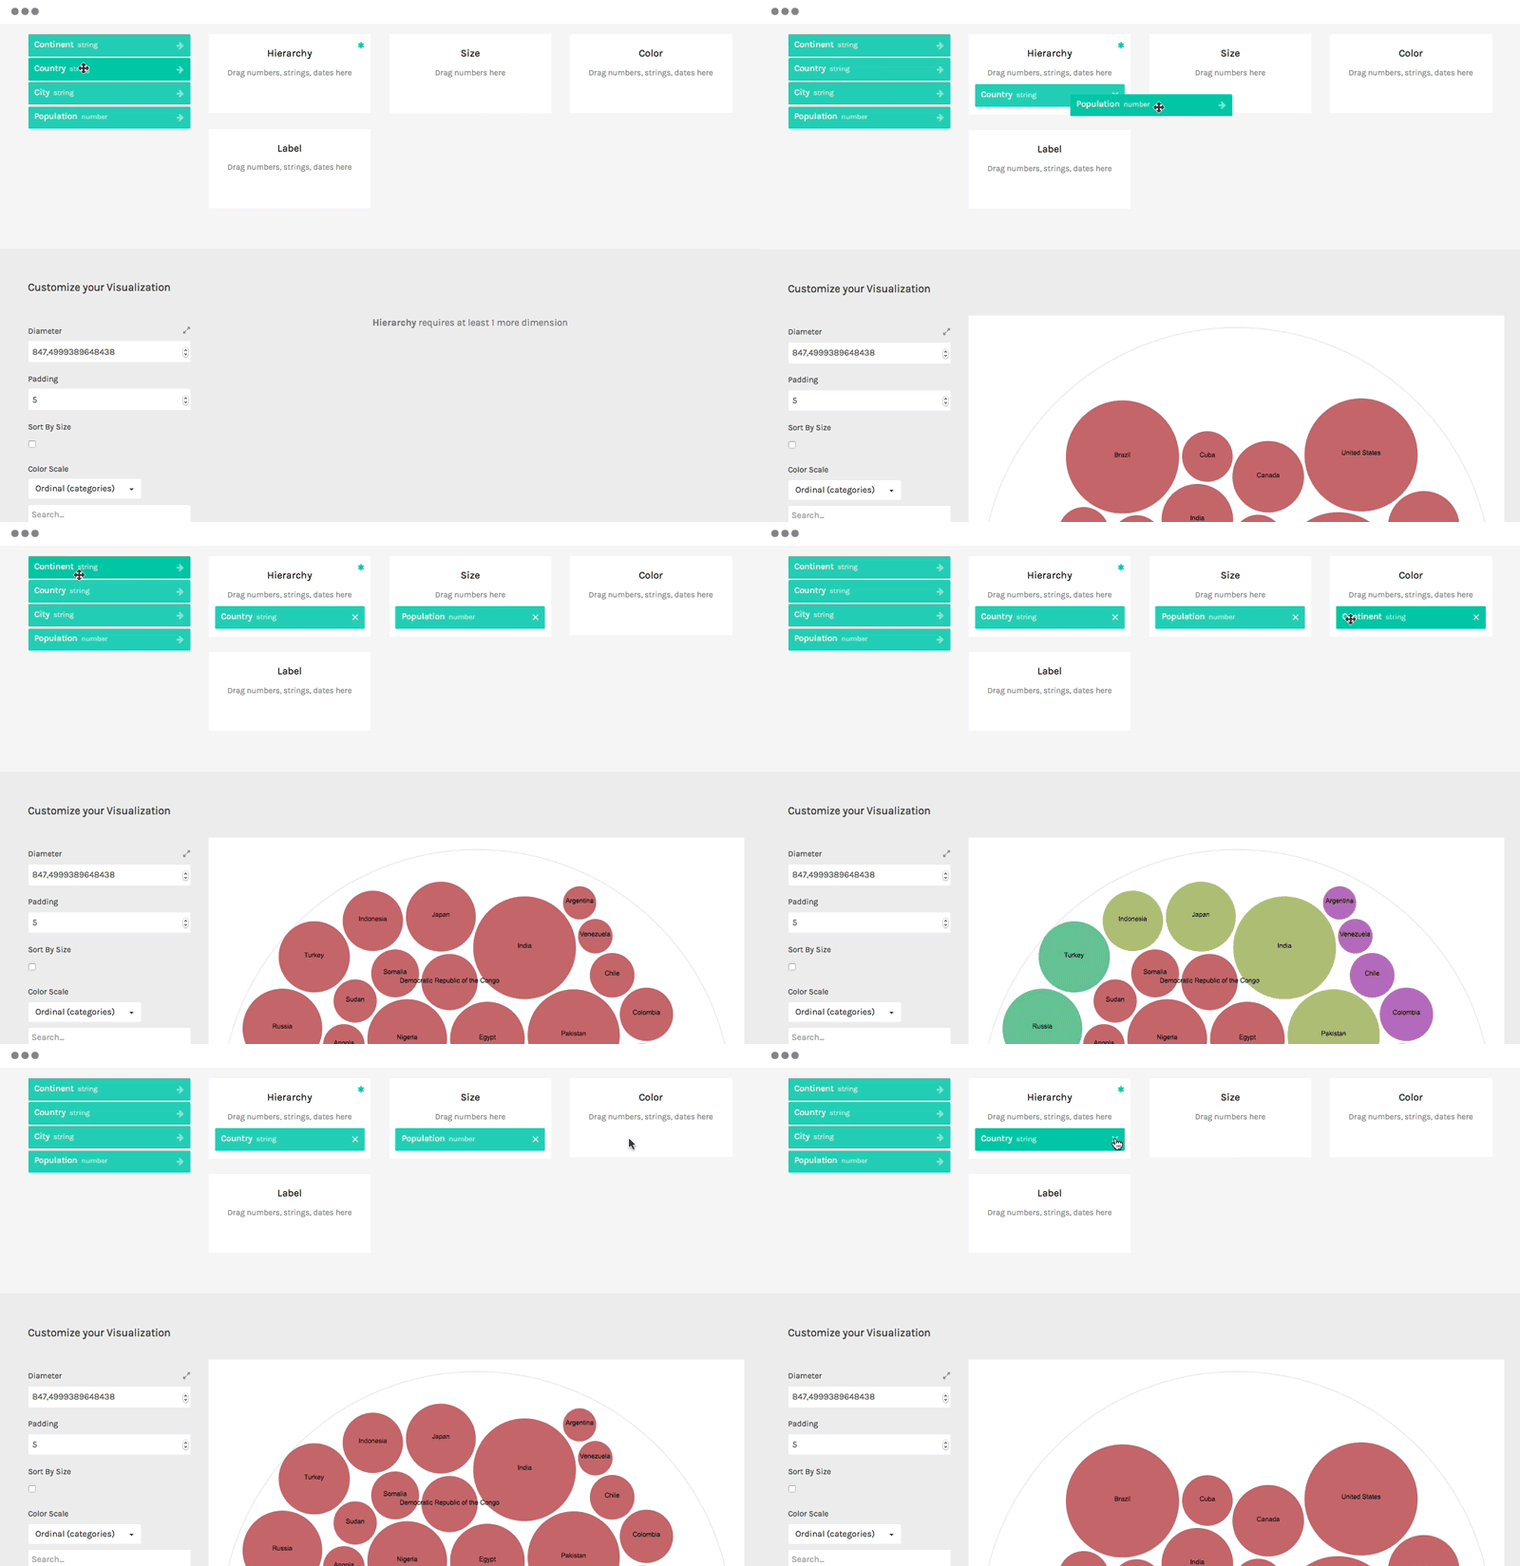
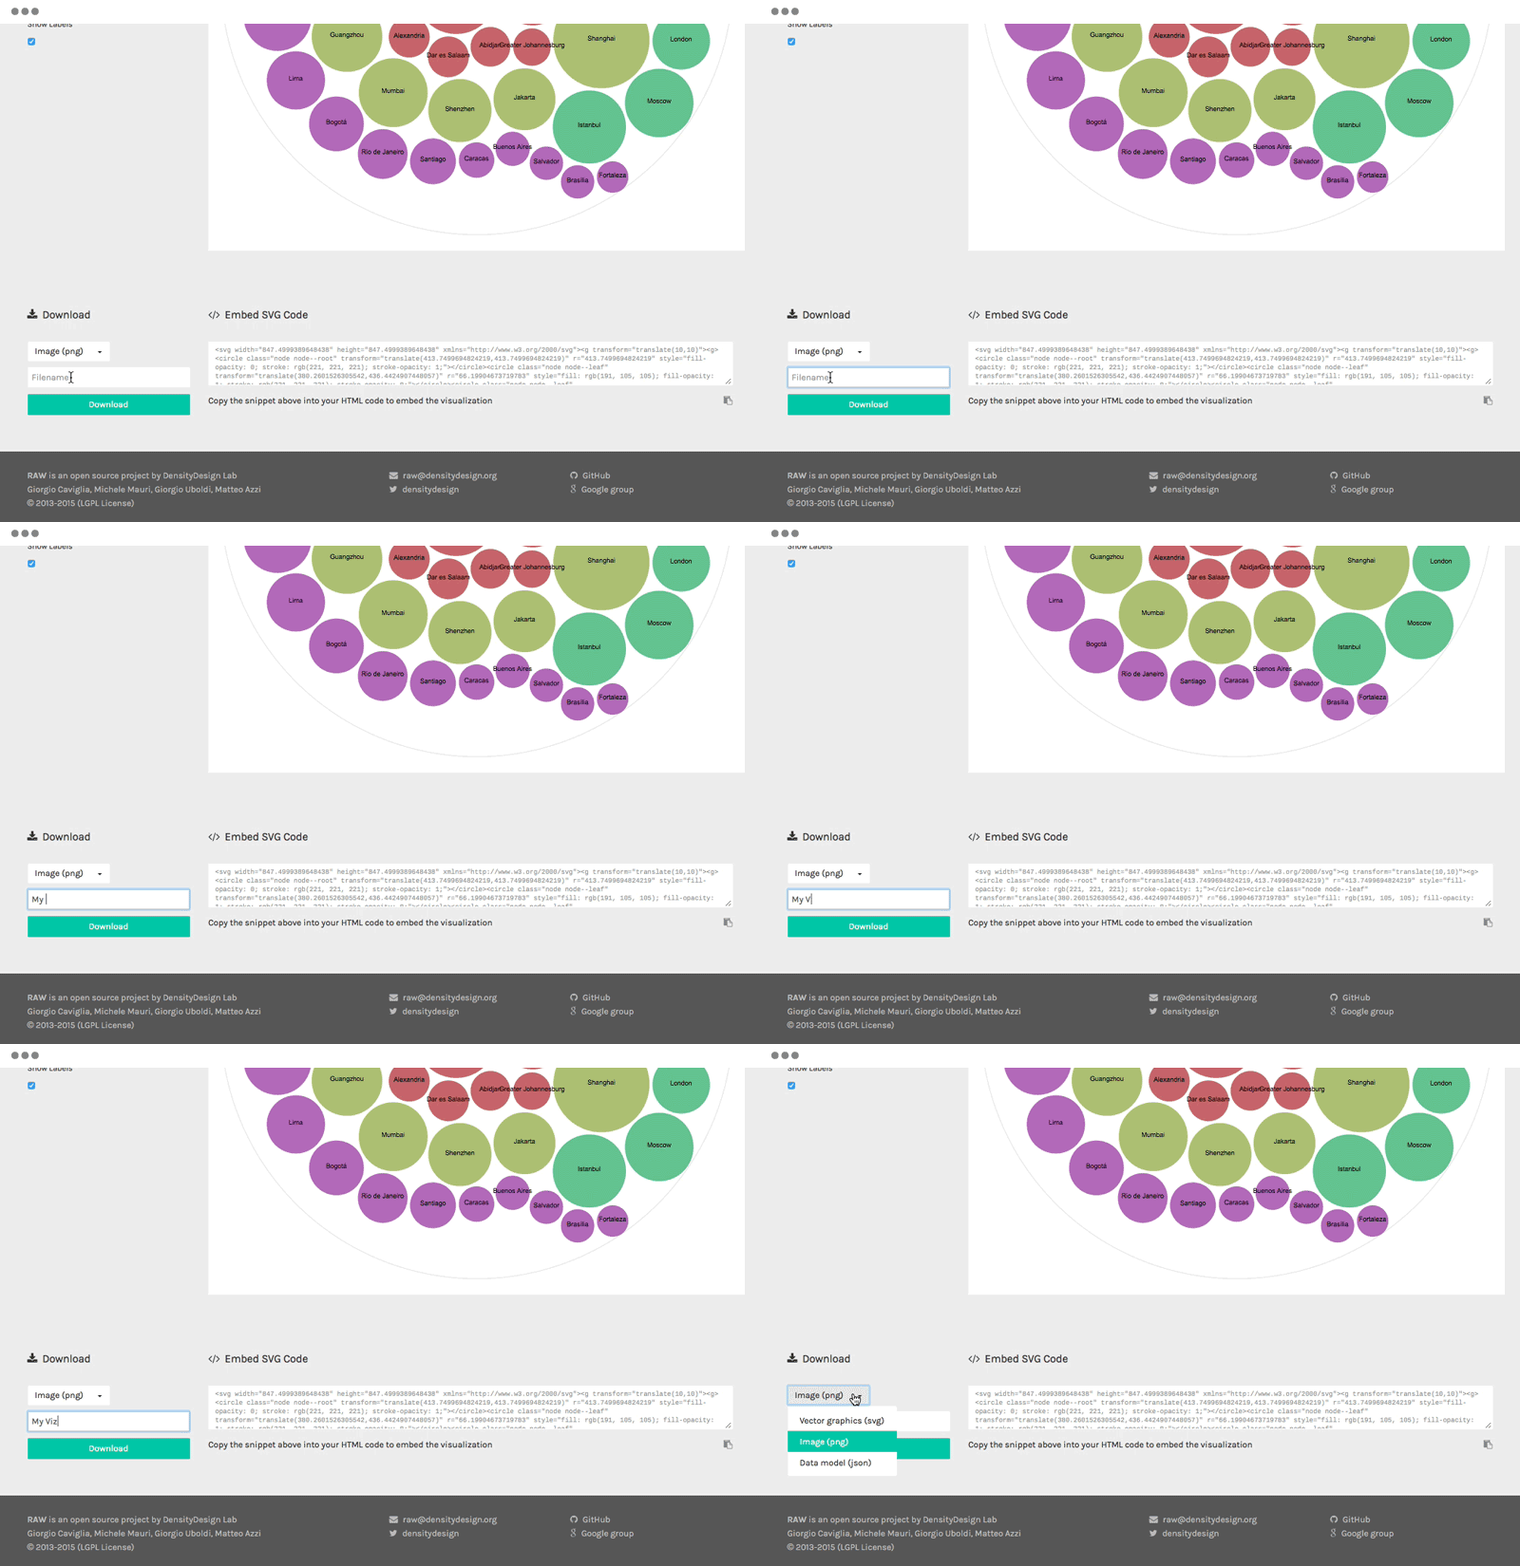
The tool allows to very easily scaffold visualizations using often complex techniques (e.g. bubble charts, alluvial diagrams), then to download them as publication-ready images or .svg files which can be reworked with vectorial images editing software such as Inkscape.


visualization
all audiences
usable
2013