ipysigmamade by the médialab
a Jupyter widget using sigma.js to render interactive networks
Tools – Software
Guillaume Plique
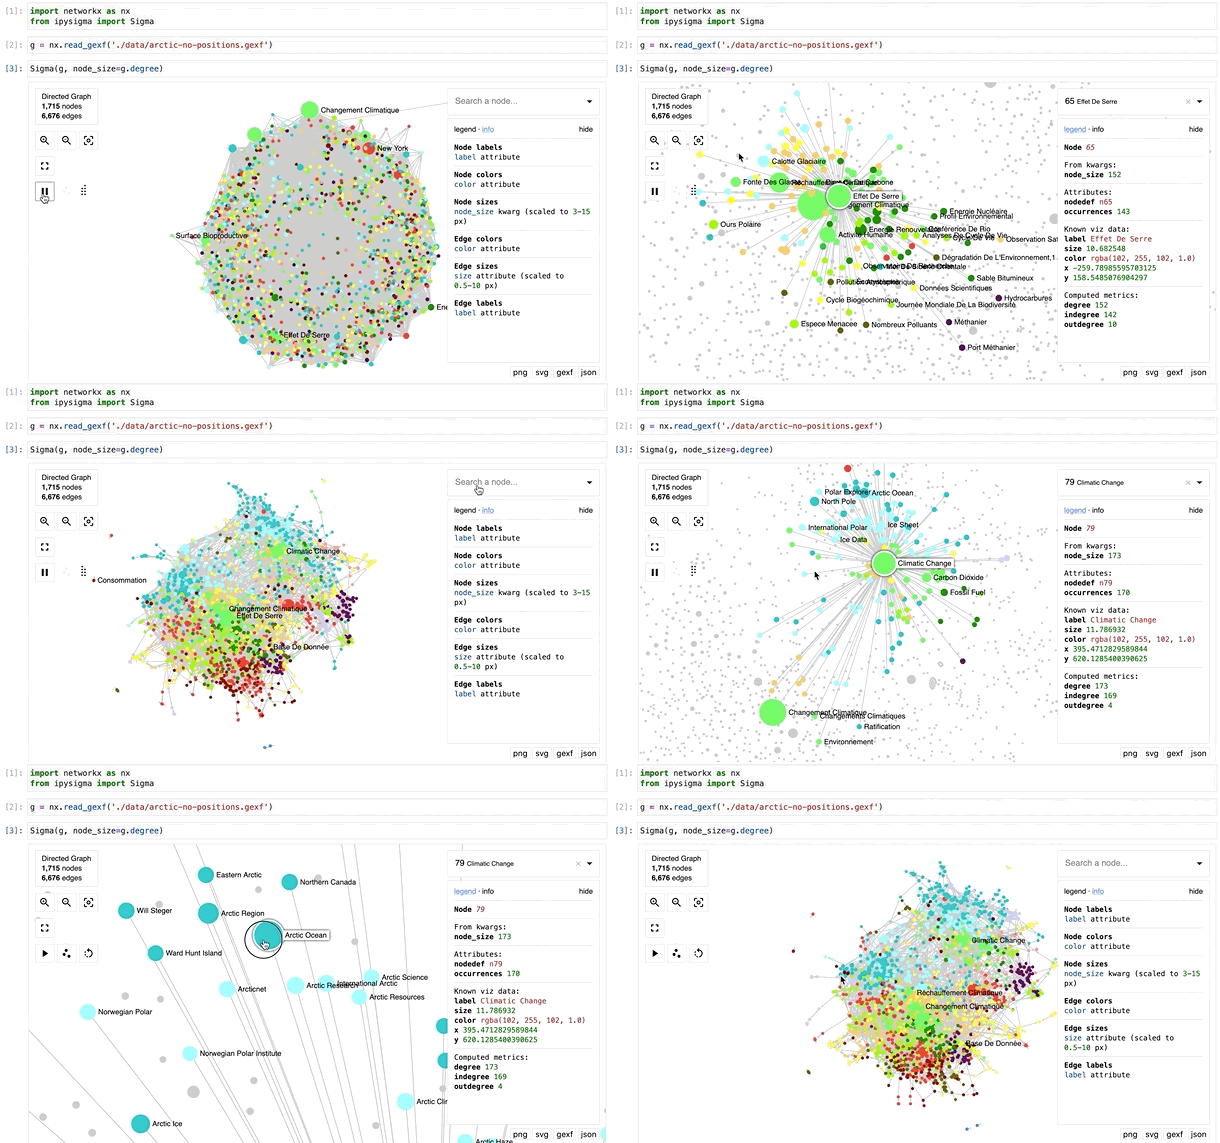
ipysigma is a Jupyter widget using sigma.js and graphology to render interactive networks directly within the result of a notebook cell.
ipysigma has been designed to work with either networkx or igraph and lets you customize a large number of the graph's visual variables such as: node color, size, label, border, halo, pictogram, shape and edge color, size, type, label, etc.

ipysigma can also be used to display small multiples of synchronized interactive graphs.

exploration and visualization
developers
usable
2022