HeatGraphmade by the médialab
a visualization tool allowing to produce heatmaps from the density of nodes in a spatialized network
Tools – Software
Mathieu Jacomy
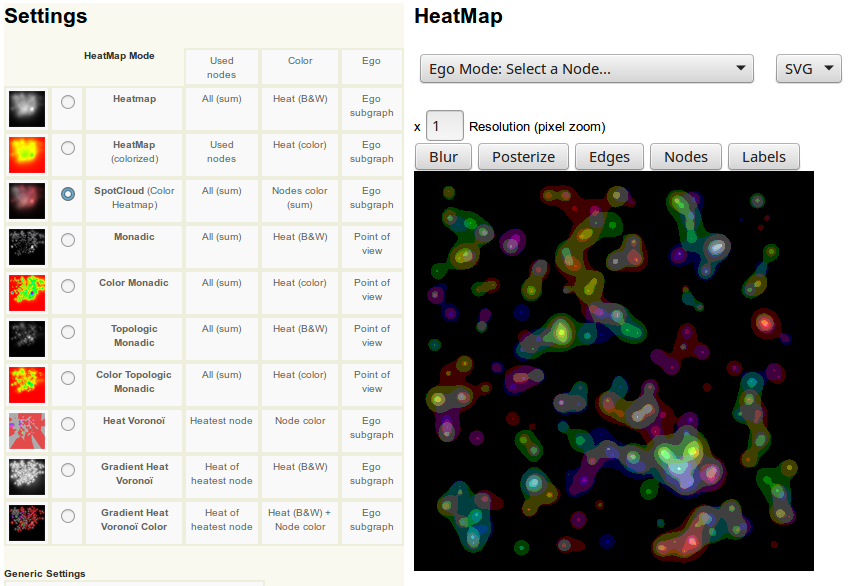
A common need to visually analyze big network graphs is to take a global approach by visualizing the density of nodes and links rather than the nodes themselves.
With many settings possibilities, HeatGraph allows to build such heatmaps very easily in just a few clicks for any network graph file under GEXF format.
visualization
all audiences
archived
2012